Is 1% FDR Really 1%? I Hid 14,567 Arabidopsis Proteins in MaxQuant, FragPipe and DIA-NN Searches
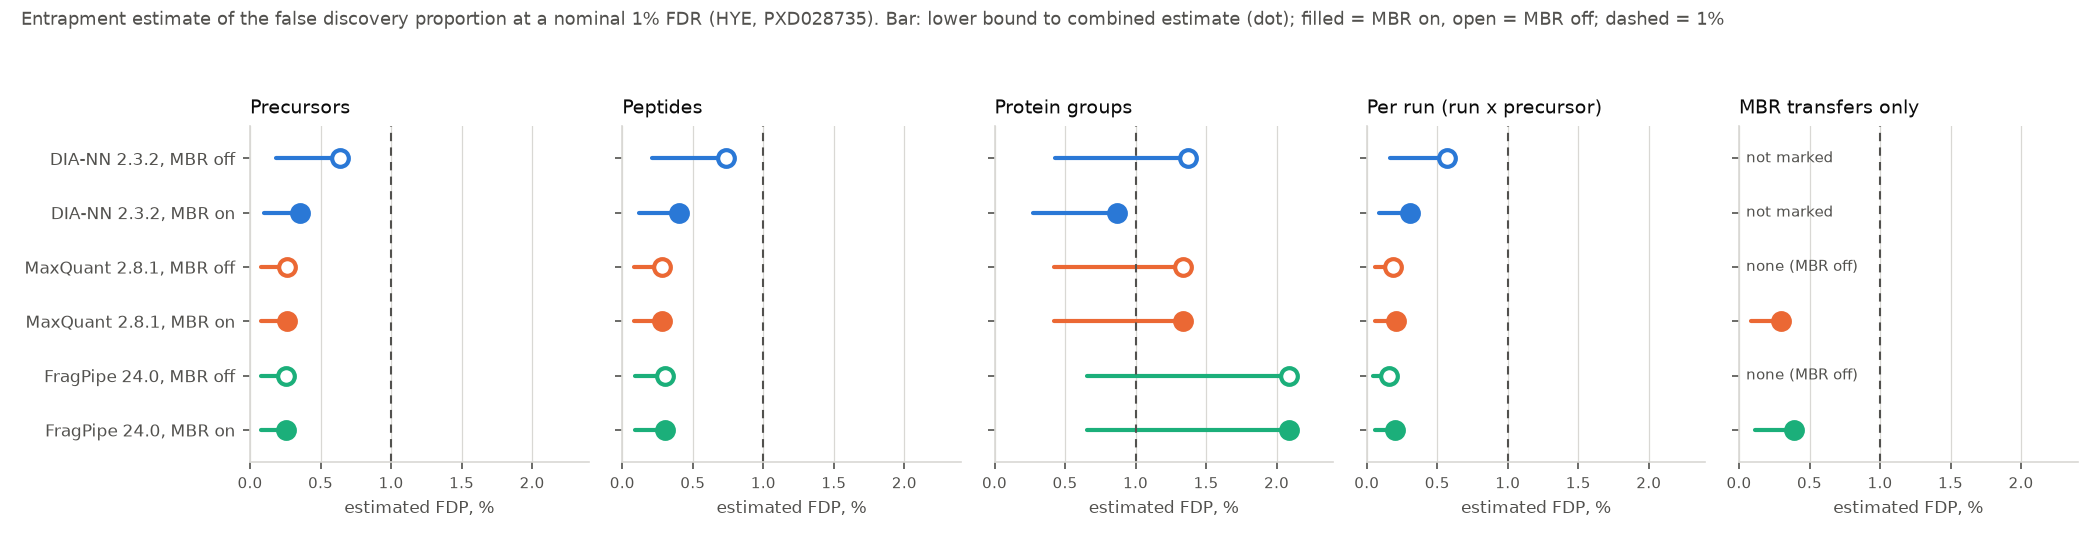
I added an Arabidopsis proteome that cannot be in the sample to the search database of the same human, yeast and E. coli runs, and counted how often MaxQuant 2.8.1, FragPipe 24 and DIA-NN 2.3.2 reported it at 1% FDR. Precursors and peptides stayed well inside 1%. Protein groups did not always: the estimate was 2.09% for FragPipe, 1.33% for MaxQuant and 1.37% for DIA-NN without MBR. Match-between-runs transfers added little error.
Every search here was run on my own workstation on public data, and the counts, scoring script and figure are public. CI re-runs the scoring from the bundled counts and checks the numbers byte for byte. No client data was used. (한국어판: 1% FDR은 정말 1%인가)
This is the fourth post in a series where I run proteomics software on public data with a known answer. The earlier ones scored quantification: MaxQuant 2.8, FragPipe vs MaxQuant and DIA-NN against both. This one asks a question those posts took for granted. When a search engine says its list is filtered at 1% FDR, are about 1% of the identifications on it actually wrong?
The target-decoy method behind that 1% (Elias and Gygi 2007) can't check itself. The decoys are the yardstick, so a tool that handles decoys and real false hits differently will report 1% with confidence either way. An independent check needs false hits whose identity the tool doesn't know.
The idea: proteins that cannot be there
The sample is the same three-species mix as before: PRIDE PXD028735 (Van Puyvelde et al. 2022), human, yeast and E. coli digests at known proportions. To its database of 31,695 Swiss-Prot proteins I added the Swiss-Prot proteome of Arabidopsis thaliana. A plant proteome cannot be in that mixture, so every Arabidopsis identification is false. I first removed the 1,854 Arabidopsis proteins that share any tryptic peptide with the targets (histones, ubiquitin, actin and the like), which left 14,567 entrapment proteins with no fully tryptic peptide in common with the targets. Nothing in the FASTA headers tells the search engine which proteins are which.
Counting the entrapment hits is not enough on its own, because false hits also land on the real proteins. Following Wen et al. (2025), two numbers come out of each list. With N_T target and N_E entrapment identifications, the lower bound N_E / (N_T + N_E) assumes every entrapment hit is false and nothing else is. The combined estimate N_E (1 + 1/r) / (N_T + N_E) also counts the false hits expected among the targets, where r is the size of the entrapment relative to the targets. Here r was 0.41 for peptides and 0.46 for proteins, so each entrapment hit stands for three to three and a half false hits in total. Wen et al. describe the combined estimate as an estimated upper bound: on average it reads high. A lower bound above 1% means the list is certainly more than 1% wrong, which Wen et al. count as evidence of failing to control the FDR. A combined estimate above 1% is a warning.
What I ran
Everything matched the earlier posts except the database:
| MaxQuant 2.8.1 | FragPipe 24.0 | DIA-NN 2.3.2 | |
|---|---|---|---|
| Runs | 6 Orbitrap DDA | the same 6 Orbitrap DDA | 6 TripleTOF 6600+ SWATH |
| Settings | the MaxQuant post | LFQ-MBR workflow, as in the FragPipe post | library-free, as in the DIA-NN post |
| Searches | MBR on, MBR off | MBR on, MBR off | MBR on, MBR off |
| Threads | 16 | 8 | 24 |
| Wall time | 10 h 40 min, 5 h 42 min | 16.5 min, 15 min | 10 h 57 min, 3 min 42 s |
Each engine also has a search against the targets alone, to measure what the bigger database costs. DIA-NN's MBR-off search reused the first pass of the MBR-on search, which is why it took minutes. The times say little about speed: the first MaxQuant search and the DIA-NN search ran at the same time on one 32-core machine, and MaxQuant wrote to a Windows drive mounted in WSL. In the earlier posts the same runs took 62 min, 9 min and 6 h 17 min.
MaxQuant and FragPipe only write what passes their 1% filters, so their lists are taken as reported. MaxQuant protein groups are also cut at its Q-value ≤ 0.01, which removes nothing beyond the 1% list, and groups identified only by a modification site are left out. DIA-NN reports q-values, so I cut at 0.01.
Results at 1%
Combined estimate, lower bound in brackets:
| Search | Precursors | Peptides | Protein groups |
|---|---|---|---|
| DIA-NN, MBR off | 0.64% (0.18%) | 0.74% (0.21%) | 1.37% (0.43%) |
| DIA-NN, MBR on | 0.35% (0.10%) | 0.40% (0.12%) | 0.87% (0.27%) |
| MaxQuant, MBR off | 0.26% (0.08%) | 0.28% (0.08%) | 1.33% (0.42%) |
| MaxQuant, MBR on | 0.26% (0.08%) | 0.28% (0.08%) | 1.33% (0.42%) |
| FragPipe, MBR off | 0.26% (0.07%) | 0.30% (0.09%) | 2.09% (0.66%) |
| FragPipe, MBR on | 0.26% (0.07%) | 0.30% (0.09%) | 2.09% (0.66%) |
At the precursor and peptide level every engine is inside 1%, most with room to spare. MaxQuant reported 48,943 target precursors and 37 entrapment precursors; FragPipe 80,897 and 60.
Protein groups are a different story. FragPipe reported 52 Arabidopsis protein groups among 7,913, MaxQuant 23 among 5,481, and DIA-NN without MBR 37 among 8,558. The combined estimates put all three above 1%, FragPipe at about twice it. With the Arabidopsis entrapment none of the lower bounds reaches 1% (the shuffled entrapment in the update below changes this for FragPipe), so this is not proof that any of them failed; Wen et al. call a result like this inconclusive. The true error lies between the lower bound and the estimate, and with 23 to 52 entrapment groups both are noisy (for a count of 23, the 95% range runs from about 15 to 35). Still, a protein list "at 1% FDR" from these settings could be 1.3–2% wrong.
I checked one obvious explanation for FragPipe and ruled it out. FragPipe writes a protein list per experiment, and the union of six 1% lists could hold more false hits than any one of them. Here the union was identical to FragPipe's combined protein list (7,913 groups, 52 of them Arabidopsis), because Philosopher filters each experiment against the same combined protein inference (combined.prot.xml). The 2.09% belongs to that one list.
Why proteins and not peptides? A protein group passes on the strength of its peptides, and the false ones here rested on very few: 47 of FragPipe's 52 Arabidopsis groups and 19 of MaxQuant's 23 had a single peptide, and none had more than two. The protein-level FDR is a separate calculation with its own assumptions in each tool, and it is also where the entrapment estimate is roughest: protein length, grouping and minimum-peptide rules all bend the assumption that false hits land on entrapment in proportion to r.
Update (18 November 2026): a second entrapment, and a tighter estimate
A reasonable objection to everything above is that it rests on one entrapment design. So I repeated all six searches with the other design from Wen et al.: one shuffled copy of every target protein, with the residues shuffled inside each tryptic peptide so masses, lengths and cleavage sites stay the same (31,461 entrapment proteins, r = 1.04 for peptides). Because each shuffled peptide has a twin among the targets, this design also allows Wen et al.'s paired estimate, a tighter upper bound than the combined one. I implemented it for all three engines and checked it with 21 checks on synthetic data with known answers.
| Search | Peptides: paired (lower bound) | Protein groups: paired (lower bound) |
|---|---|---|
| DIA-NN, MBR off | 0.58% (0.35%) | 1.02% (0.75%) |
| DIA-NN, MBR on | 0.32% (0.20%) | 0.93% (0.72%) |
| MaxQuant | 0.35% (0.17%) | 1.47% (0.89%) |
| FragPipe | 0.25% (0.15%) | 1.63% (1.11%) |
The two designs agree. Peptide-level combined estimates landed within a few hundredths of a percent of the Arabidopsis run, although the entrapment-to-target ratio differs 2.5-fold. At the protein level the picture got sharper: FragPipe's lower bound is now 1.11%, above the nominal 1%, so the false share of this protein list is above 1% for certain (every shuffled hit is false), which Wen et al. count as evidence that FragPipe does not control protein-group FDR. MaxQuant is probably above 1% (paired 1.47%). DIA-NN is borderline without MBR (1.02%), and with MBR its paired estimated upper bound of 0.93% supports control (the paired estimate is the tighter bound when r = 1; at r = 1.04 it can come out marginally above the combined one, as for MaxQuant peptides). MBR transfers stayed low: 89 of 59,899 in MaxQuant and 110 of 79,736 in FragPipe were entrapment. The data, paired.py and its test are in the benchmark folder.
Match-between-runs: the counting trap
My first count said MBR changed nothing at all in MaxQuant: identical numbers with it on and off, at every level. That turned out to be a property of the counting, not of MaxQuant. MBR does not add sequences to the experiment. It takes a precursor identified by MS/MS in one run and transfers it to runs where it had no MS/MS. Counting each sequence once for the whole experiment cannot see that.
So I added a count per run, every run-and-precursor pair, and a count of the transfers alone. MaxQuant 2.8.1 writes its transfers in evidence.txt with an empty Type (older versions wrote MULTI-MATCH), a Match time difference and no MS/MS. FragPipe marks them MBR in the Match Type columns of combined_ion.tsv.
| All per-run identifications | Transfers only | |
|---|---|---|
| MaxQuant, MBR off | 0.19% (102 of 187,074) | none |
| MaxQuant, MBR on | 0.21% (146 of 240,783) | 0.30% (52 of 60,189) |
| FragPipe, MBR off | 0.15% (144 of 323,406) | none |
| FragPipe, MBR on | 0.20% (232 of 401,633) | 0.39% (88 of 78,227) |
| DIA-NN, MBR off | 0.57% | not marked |
| DIA-NN, MBR on | 0.31% | not marked |
The transfers carry more error than the per-run identifications without MBR, 1.6 times as much in MaxQuant and 2.5 times in FragPipe, but they start from a very low base and stay well under 1%. On this data, MBR is not where the false identifications come from.
DIA-NN does not mark transfers. Its MBR mode re-searches all runs with a library built from the first pass, and that lowered the entrapment count at every level (100 entrapment precursors with MBR, 189 without). A likely reason is that an entrapment precursor has to survive the first pass to be searched again. FragPipe also showed an MBC match type in combined_ion.tsv. IonQuant doesn't document it, but it is not MBR: the same 12,440 MBC ions appeared with MBR off.
The price of a bigger database
Adding 41% more peptides to score against also cost real identifications. Against the target-only searches, DIA-NN lost 8.3–8.5% of its precursors, MaxQuant 3.5–4.0% (the two ends use different target-only searches; MBR changes nothing here) and FragPipe 1.2%. That is a reminder that padding a FASTA "just in case" (all of UniProt, extra species, every isoform) is not free, and that DIA-NN's library-free search pays the most for it here.
Two things that broke on the way
Both were about where files live, and both cost hours. MaxQuant writes large intermediate folders next to the raw files; for these six runs they reached 30 GB before the first search was done. I ran everything in WSL, whose virtual disk sits on the Windows C: drive, so Linux still showed 105 GB free while C: ran out, and WSL shut down mid-search. Later, Windows' page file on the same drive grew from 64 to 79 GB while the searches held a lot of memory. Moving the work folders to a separate drive fixed it.
FragPipe then failed on that drive after about seven and a half minutes, at a step called "MSFragger move pepxml", with Operation not permitted. It moves its output from the folder of the mzML files to the work folder and tries to copy file attributes, which a Windows drive mounted in WSL refuses. With the work folder on the same file system as the mzML files, each search took about 15 minutes.
What I would do with this
The 1% FDR on precursors and peptides held for all three tools on this data, with or without MBR. If your analysis lives at the peptide level, this test gives no reason to distrust it. Protein lists deserve more caution. When the exact protein list matters, for a claimed biomarker or a "detected in sample" statement, allow that a reported 1% protein FDR may be up to 1.3–2% for these tools and settings. Requiring two peptides would remove most of the false groups here, at a cost of 14% of FragPipe's and 10% of MaxQuant's real protein groups; checking the single-peptide proteins by hand is the cheaper option. And if you compare MBR on and off, count per run, or you will find nothing.
Limits
This is one dataset, two entrapment designs and one search per setting, so small differences between engines (0.26% against 0.35%) mean little. DIA-NN saw different acquisitions of the same samples (SWATH on a TripleTOF instead of DDA on an Orbitrap), so compare it with the other two only loosely. The combined estimate depends on r and on false hits landing on entrapment sequences in proportion to their share, which holds better for peptides than for protein groups. FragPipe's contaminant proteins carry no contam_ prefix and are counted as targets, which lowers its estimates very slightly. DIA-NN's MBR-off search reused the first pass of the MBR-on search, and DIA-NN warns that this differs from a fresh analysis; the target-only MBR-off search from the earlier post was made the same way. The paired estimate is available only for the shuffled entrapment (see the update above).
Reproduce it
Database builder, the manifest format, the counting script for all three engines, the scoring script, the counts and the figure: sbmlab-benchmarks/entrapment-fdr-hye. A synthetic test with 35 known answers checks the counting for each engine's output format. The search outputs themselves are tens of gigabytes and are not bundled.
References
- Wen B, Freestone J, Riffle M, MacCoss MJ, Noble WS, Keich U. Assessment of false discovery rate control in tandem mass spectrometry analysis using entrapment. Nat Methods 2025;22(7):1454-1463.
- Van Puyvelde B, et al. A comprehensive LFQ benchmark dataset on modern day acquisition strategies in proteomics. Sci Data 2022;9:126.
- Elias JE, Gygi SP. Target-decoy search strategy for increased confidence in large-scale protein identifications by mass spectrometry. Nat Methods 2007;4(3):207-214.
Related
Related
DIA-NN 2.3 on a Known-Answer Benchmark: How It Compares With MaxQuant and FragPipe (and Why the Comparison Has a Catch)
Oct 13 · 11 min read
ProteomicsProteomics CV: What Replicate CVs Look Like in MaxQuant, FragPipe and DIA-NN (Measured on a Known-Ratio Benchmark)
Oct 16 · 8 min read
ProteomicsFragPipe vs MaxQuant, Measured: Same Six Runs, Same Known Answer (9 Minutes vs 62)
Oct 7 · 10 min read
ProteomicsDIA-NN Quantification Modes Scored on Known Ratios: QuantUMS, Legacy MaxLFQ and Fragment-Level Re-Quantification, With and Without MBR
Oct 17 · 17 min read