DIA-NN Quantification Modes Scored on Known Ratios: QuantUMS, Legacy MaxLFQ and Fragment-Level Re-Quantification, With and Without MBR
One set of DIA-NN 2.3.2 identifications, seven ways to turn it into protein quantities, scored against known ratios. Without MBR the MaxLFQ-type routes land within about 4 points of each other. With MBR, the strongly changed proteins MBR adds are compressed: QuantUMS handles them best, and re-quantifying them from raw fragments is much worse.
In the DIA-NN benchmark post I scored DIA-NN's protein matrix, which DIA-NN quantifies with QuantUMS by default. That raised an obvious follow-up: would it be better to switch QuantUMS off, or to take DIA-NN's fragment intensities and run MaxLFQ (or directLFQ) on them yourself, one level deeper than precursors?
I tested it on the same public benchmark with known ratios. Within each comparison (MBR off, MBR on) every route starts from the same DIA-NN identifications, so the only thing that differs is how intensities become protein quantities.
Short answer
E. coli proteins (true log2 ratio +2, the hardest of the three species): share with a ratio within ±0.5 of the truth. Each route is scored on its own protein list; n is about 300 / 300 / 145 per column for most routes.
| Route | MBR off | MBR on: proteins also quantified without MBR | MBR on: proteins only quantified with MBR |
|---|---|---|---|
| QuantUMS, default (high-precision) | 89.6% | 94.6% | 74.0% |
| QuantUMS, high-accuracy | 90.3% | 95.3% | 70.5% |
| Legacy (direct) MaxLFQ | 91.6% | 96.6% | 62.4% |
| Fragment directLFQ | 90.8% | 93.0% | 45.1% |
| Fragment MaxLFQ (iq) | 87.5% | 87.4% | 33.1% |
| Sum of precursor intensities | 34.3% | 53.6% | 25.7% |
| Same sum, only precursors quantified in all 6 runs | 93.2%* | 92.7%* | 80.9%* |
"Only with MBR" means only quantified with MBR by that route. *The all-6-run sum covers fewer proteins (235 / 234 / 115), because a protein needs complete precursors to be included, and these are the easier proteins: about half of its 115 were quantified by DIA-NN's own modes even without MBR. Compare it on the same proteins, as further down.
- Without MBR, the five MaxLFQ-type routes landed within about 4 points of each other. DIA-NN's legacy mode was marginally best and had the lowest replicate CVs, but the DIA-NN documentation warns that CVs are not a fair comparison between its modes (more below).
- With MBR, the order changes for the proteins MBR adds. These are low-abundance and compressed toward 1:1. For E. coli, QuantUMS kept 74% of them within ±0.5, legacy 62%, and re-quantifying the same identifications from fragment intensities 33–45%. For human and yeast, legacy was the better of DIA-NN's modes on those proteins, so neither mode wins everywhere.
- Summing precursor intensities failed mainly because of missing values. On the same proteins, restricting the sum to precursors quantified in all six runs raised the share within ±0.5 from 27% to 81%, though it stayed a little behind QuantUMS.
The data and the runs
Same data as the earlier posts: PRIDE PXD028735 (Van Puyvelde et al. 2022), human, yeast and E. coli digests mixed so that log2(B/A) is 0, −1 and +2. TripleTOF 6600+ SWATH runs, conditions A and B, preparation batches Alpha, Beta and Gamma, first injection each (3 vs 3). Library-free search with a library predicted from a human + yeast + E. coli Swiss-Prot FASTA, settings as in the DIA-NN post.
One caveat up front: DIA-NN's documentation says to "always keep MBR enabled for quantitative analyses" when searching with a predicted library, as here. I include the MBR-off results because they show what the quantification modes do without MBR in the way, not as a recommended setup.
For this comparison I reran DIA-NN 2.3.2 from scratch with three changes:
--export-quant, which adds the observed, non-normalised apex intensities of each precursor's top-12 library fragments in every run (Fr.0.Quantity…Fr.11.Quantity) toreport.parquet.- Mass accuracies and scan window fixed at the values DIA-NN chose in the original run (
--mass-acc 16 --mass-acc-ms1 13 --window 9). The DIA-NN documentation recommends fixing these when.quantfiles are reused, and it means every run below uses identical search settings. - The
.quantfiles written by the first run were reused for every other mode (--use-quant).
| Run | DIA-NN flags (on top of the common ones) | Wall time |
|---|---|---|
| MBR on, QuantUMS default | --reanalyse | 9 h 20 min (first pass 62–67 min per file, second ~28) |
| MBR off, QuantUMS default | --use-quant | 4 min |
| MBR off, QuantUMS high-accuracy | --use-quant --high-acc | 4 min |
| MBR off, legacy | --use-quant --direct-quant | 2 min |
| MBR on, QuantUMS high-accuracy | --use-quant --reanalyse --high-acc | 2 h 57 min |
| MBR on, legacy | --use-quant --reanalyse --direct-quant | 3 h 6 min |
DIA-NN's log confirms each mode ("High accuracy quantification mode enabled", "Legacy (direct) quantification mode"). "MBR off" here means the first-pass results, searched against the predicted library. With MBR on, reusing .quant only skips the first pass; the second pass reads the raw files again, which is why those runs take hours. Without MBR, switching quantification mode cost minutes. (The documentation describes this shortcut for analyses with an empirical library; it worked the same way here with the first-pass results.)
From each run I built protein quantities these ways:
- DIA-NN's
pg_matrixfor the three built-in modes. - Fragment MaxLFQ (iq): each
Fr.N.Quantitymultiplied by that precursor's normalisation factor in that run (Precursor.Normalised / Precursor.Quantity; DIA-NN's normalisation is precursor-specific), each precursor-fragment pair treated as one ion, then MaxLFQ with the iq R package (Pham et al. 2020), with iq's own median normalisation switched off. Fragments come from the QuantUMS-default run of each set. - Fragment directLFQ: the same fragment table into directLFQ (Ammar et al. 2023), which applies its own sample normalisation on top of DIA-NN's.
- Precursor sum: sum of
Precursor.Normalisedfrom the QuantUMS-default run per protein group, and the same sum restricted to precursors quantified in all six runs.
The precursors going in are exactly the ones DIA-NN puts in its own pr_matrix: I checked which q-value filter reproduces that matrix cell for cell. Without MBR it is Global.Q.Value ≤ 0.01 and Global.PG.Q.Value ≤ 0.01 (513,461 precursor × run values); with MBR it is Lib.Q.Value ≤ 0.01 and Lib.PG.Q.Value ≤ 0.01 (601,406). Why that matters is under "Traps" below.
Scoring is the same as in the earlier posts: a protein needs values in at least 2 of 3 runs per condition; log2(B/A) is the difference of mean log2 quantities; "within ±0.5" means within 0.5 log2 units of the truth, uncentred. Contaminants (MaxQuant's list) and protein groups mapping to more than one species were removed. CV is the standard deviation over the mean of the three linear values per condition, computed only when all three exist.
Without MBR
Proteins quantified by every route (7,289):
| Route | Human: median, IQR, within | Yeast: median, IQR, within | E. coli: median, IQR, within | Median CV, E. coli |
|---|---|---|---|---|
| QuantUMS default | −0.01, 0.08, 98.9% | −1.07, 0.17, 96.1% | 2.11, 0.20, 89.6% | 5.1% |
| QuantUMS high-accuracy | 0.00, 0.08, 99.0% | −1.06, 0.17, 96.1% | 2.11, 0.19, 90.3% | 5.0% |
| Legacy MaxLFQ | 0.00, 0.07, 99.1% | −1.05, 0.13, 97.7% | 2.09, 0.20, 91.6% | 4.3% |
| Fragment MaxLFQ (iq) | −0.02, 0.08, 99.1% | −1.00, 0.25, 95.7% | 2.03, 0.35, 88.3% | 5.4% |
| Fragment directLFQ | −0.02, 0.10, 98.2% | −1.05, 0.21, 95.7% | 2.09, 0.24, 91.3% | 6.3% |
| Precursor sum | 0.02, 0.25, 81.4% | −1.37, 0.84, 54.8% | 2.80, 1.16, 34.9% | 8.7% |
| Precursor sum, all-6-run precursors* | −0.01, 0.09, 99.0% | −1.09, 0.17, 96.8% | 2.13, 0.20, 93.6% | 5.6% |
*Covers 4,413 human, 1,519 yeast and 234 E. coli of these proteins. This table uses the 7,289 proteins every route quantified, so some percentages differ slightly from the short answer, which uses each route's own list.
What I read from it:
- There was no ratio compression to fix. Every MaxLFQ-type route put the E. coli median slightly above 2. QuantUMS high-accuracy, which the documentation recommends "when it is desirable to minimise the ratio compression at the cost of precision", changed almost nothing (90.3% vs 89.6%).
- Fragment-level MaxLFQ gave the median closest to the truth (2.03) but the widest spread (IQR 0.35 against about 0.20 for DIA-NN's own modes). Using more ions per protein did not tighten the ratios.
- Legacy mode had the lowest CVs. That alone doesn't make it better. The DIA-NN documentation says QuantUMS "does not have the objective to minimise CV values", so CVs are not a fair comparison between modes, and it recommends legacy mode when benchmarking LC-MS settings for that reason. On accuracy, the five MaxLFQ-type routes were within about 3 points on these proteins.
With MBR
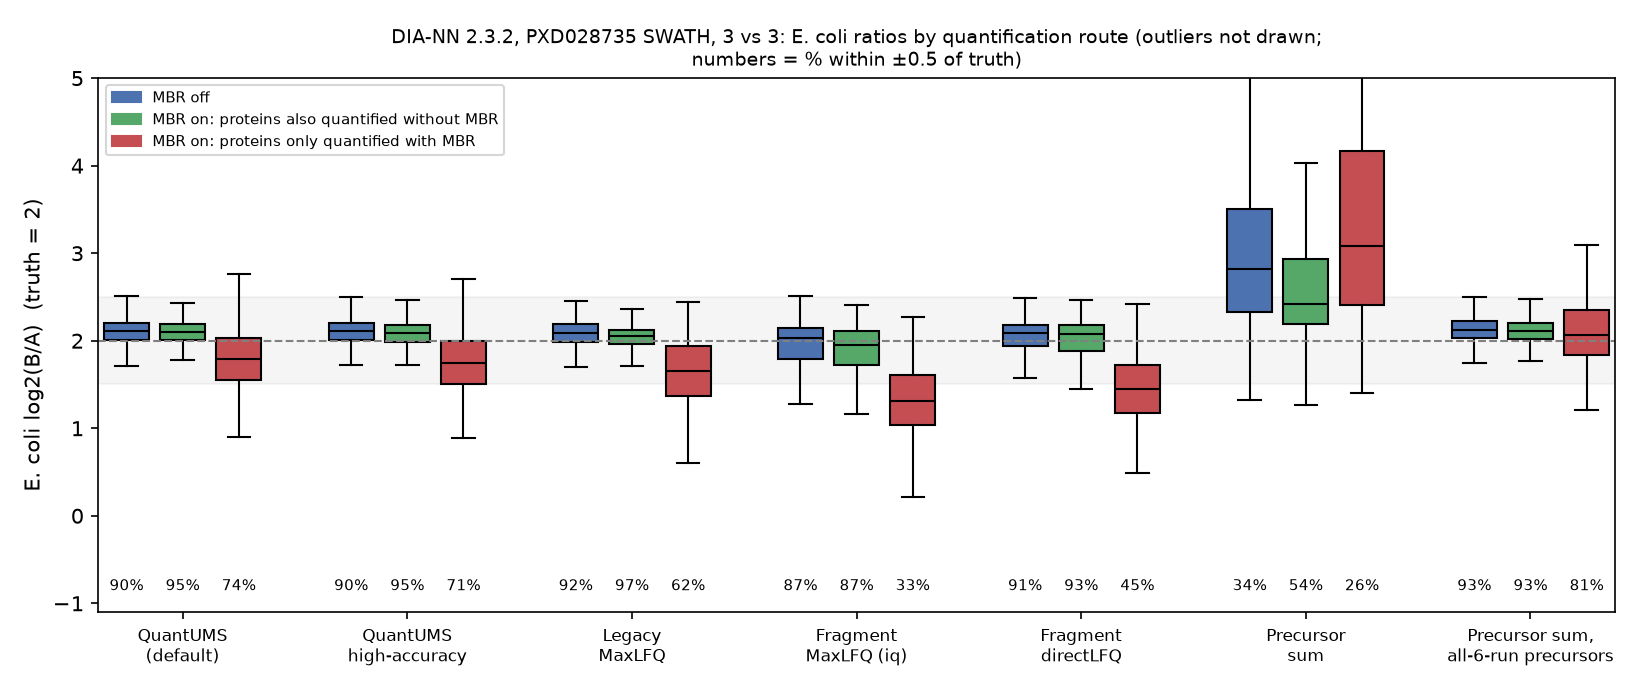 E. coli log2(B/A) per route. Blue: MBR off. Green: with MBR, proteins that were also quantified without it. Red: proteins only quantified with MBR. Numbers under the boxes: % within ±0.5 of the truth. The shaded band is ±0.5.
MBR raised the number of E. coli proteins that could be scored from about 300 to about 440. I split each route's proteins into those it also quantified without MBR and those it only quantified with MBR:
| Route | Species | MBR off | MBR on, also without MBR | MBR on, only with MBR |
|---|---|---|---|---|
| QuantUMS default | Human (0) | 98.8% (n = 5,100) | 99.4% (5,093) | 87.6% (378) |
| Yeast (−1) | 96.0% (1,922) | 97.9% (1,921) | 84.9% (436) | |
| E. coli (+2) | 89.6% (298) | 94.6% (297) | 74.0% (146), median 1.79 | |
| QuantUMS high-accuracy | Human | 98.8% (5,100) | 99.3% (5,093) | 87.0% (378) |
| Yeast | 95.9% (1,922) | 97.9% (1,921) | 85.3% (436) | |
| E. coli | 90.3% (298) | 95.3% (297) | 70.5% (146), median 1.75 | |
| Legacy MaxLFQ | Human | 98.9% (5,114) | 99.5% (5,109) | 93.0% (374) |
| Yeast | 97.5% (1,927) | 98.9% (1,926) | 88.8% (439) | |
| E. coli | 91.6% (298) | 96.6% (297) | 62.4% (149), median 1.66 | |
| Fragment directLFQ | Human | 98.0% (5,118) | 99.2% (5,111) | 87.5% (368) |
| Yeast | 95.2% (1,954) | 97.1% (1,953) | 79.6% (411) | |
| E. coli | 90.8% (303) | 93.0% (302) | 45.1% (144), median 1.45 | |
| Fragment MaxLFQ (iq) | Human | 98.8% (5,161) | 99.6% (5,153) | 93.9% (328) |
| Yeast | 95.1% (1,963) | 96.1% (1,962) | 73.5% (396) | |
| E. coli | 87.5% (303) | 87.4% (302) | 33.1% (142), median 1.31 |
Three things stand out:
- For proteins that were already there, MBR helped DIA-NN's own modes. QuantUMS E. coli went from 89.6% to 94.6%, legacy from 91.6% to 96.6%, on essentially the same proteins (fragment iq stayed at 87.5%). My guess is that the second pass, searched against an empirical library, quantifies more precursors per protein; I didn't check this directly.
- The proteins MBR added are low-abundance and compressed. Their E. coli medians sit below 2 in every MaxLFQ-type route. That is consistent with a weak signal in condition A being overestimated, which pulls the ratio toward 1:1.
- For strongly changed proteins, that is where QuantUMS earns its place. On the MBR-added E. coli proteins, QuantUMS default (74.0%) beat legacy (62.4%) by 12 points. Re-running MaxLFQ on the same identifications from raw fragment intensities made the compression much worse (iq median 1.31, 33% within; directLFQ 1.45, 45%). High-accuracy mode didn't reduce the compression here (70.5%, median 1.75); the documentation notes that it "cannot completely eliminate ratio compression for low-abundant precursors and proteins in challenging samples".
It is not a clean win for QuantUMS, though. On the MBR-added human proteins (true ratio 0, where compression costs nothing) legacy was more often within ±0.5 than QuantUMS (93.0% vs 87.6%), and likewise for yeast (88.8% vs 84.9%). Legacy's ratios were less spread out for the unchanged proteins and more compressed for the strongly changed ones.
The E. coli gap between QuantUMS and legacy is largest in the hardest proteins. I took the 146 E. coli proteins that QuantUMS only quantified with MBR and split them by whether all their precursors were quantified in all six runs:
| Route | Complete precursors (n = 64) | Incomplete precursors (n = 82) |
|---|---|---|
| QuantUMS default | 82.8% | 67.1% |
| QuantUMS high-accuracy | 79.7% | 63.4% |
| Legacy MaxLFQ | 78.1% | 52.4% |
| Fragment directLFQ | 60.9% | 35.4% |
| Fragment MaxLFQ (iq) | 46.9% | 23.8% (n = 80) |
| Precursor sum | 26.6% | 24.4% |
| Precursor sum, all-6-run precursors | 81.2% | (none covered) |
QuantUMS led legacy by 5 points where precursors were complete and by 15 points where they were not.
Over all 8,257 proteins that every route quantified with MBR on, E. coli within ±0.5 was 88.0% for QuantUMS default, 87.3% high-accuracy, 85.9% legacy, 78.5% directLFQ, 70.5% iq and 45.1% for the plain precursor sum. For human and yeast on the same proteins, legacy was slightly ahead (99.2% and 97.1%, against 98.6% and 95.5% for QuantUMS default).
I can't tell from this run exactly why the fragment routes fail on MBR-added proteins. QuantUMS weights fragments and precursors by learned quality, while the fragment routes here use every fragment equally, so interfered or noise-level fragments in the weak runs are my best guess. That is a hypothesis, not something I measured.
Why the precursor sum failed
Summing precursor intensities gave E. coli ratios that were too large (median 2.80 without MBR), not too small. The precursors come from the QuantUMS-default run; summing the legacy run's precursors was similar (36.6% within ±0.5). Among E. coli precursors that passed the filter, condition B (20% E. coli) had about three times as many quantified precursors per run as condition A (5%): 4,444 against 1,526 on average. A protein summed over 15 precursors in B and 5 in A gets an inflated ratio.
Restricting the sum to precursors quantified in all six runs removes most of the problem. On the same 64 MBR-added E. coli proteins in the table above, the plain sum had 26.6% within ±0.5 and the complete-precursor sum 81.2%. It still trailed QuantUMS (82.8%) slightly, and it can only be used for proteins with complete precursors. MaxLFQ-type methods avoid the problem by comparing each precursor or fragment only with itself across runs.
Traps I hit
The precursor filter changed which proteins were compared, and that moved every number by about 3 points. My first attempt fed the fragment and sum routes with the run-specific filter Q.Value ≤ 0.01 and PG.Q.Value ≤ 0.01. That keeps more precursor values in total (528,974), but a weak protein that misses the run-specific protein FDR in one run loses that value, so fewer E. coli proteins passed the 2-of-3 rule in the fragment routes (264 instead of 303) and the common set shrank to 264. On those 264, the fragment routes tied DIA-NN's own modes: directLFQ 94.3% and legacy 94.3%, iq 92.8% and QuantUMS 92.8%. With the filter DIA-NN's matrices use, the common set grew to 298, every route dropped by about 3 points because the added proteins are harder, and the fragment routes ended up slightly behind (directLFQ 91.3% vs legacy 91.6%, iq 88.3% vs QuantUMS 89.6%). The ranking barely moved; the absolute numbers moved as much as the gaps between routes. When you compare quantification routes, make sure they score the same proteins from the same precursors. (The run-specific version is in the repository as clean/nombr_runq.)
My first exploratory run let DIA-NN choose the mass accuracy automatically. For DIA-NN's three built-in modes, the no-MBR results from that run and from the clean rerun with fixed settings differed by less than 1 point, so it didn't matter for them. I reran anyway so that every mode used identical search settings.
.quant reuse only saves time without MBR. With --reanalyse, DIA-NN reuses the first-pass .quant files but still reads every raw file again for the second pass.
What I would do with this
These are my suggestions from one dataset, not a general rule.
- With MBR on, prefer DIA-NN's default (QuantUMS) if large changes in low-abundance proteins are what you are after. It was the best route for the strongly changed proteins MBR adds. Legacy was slightly better for unchanged and moderately changed proteins, so this is a trade-off, not a rule.
- Without MBR, the choice barely matters for accuracy. Legacy mode was marginally ahead here; re-quantifying fragments yourself added a pipeline step without a measurable gain.
- Don't re-quantify DIA-NN's MBR identifications from raw fragment intensities if you care about changed proteins. For the MBR-added yeast and E. coli proteins that route was much worse. (For unchanged human proteins iq was fine, at 93.9%.)
- Treat proteins that only appear with MBR as a lower-quality tier. Even with QuantUMS, a quarter of the added E. coli proteins were outside ±0.5. DIA-NN's quality columns (
PG.MaxLFQ.Quality,Quantity.Quality) are the documented way to filter them; I didn't test those filters here. - Use legacy mode if you compare CVs between instruments or methods, as the DIA-NN documentation recommends.
- Never sum precursor intensities across runs that have missing values.
Limitations
- One dataset, one instrument, 3 vs 3. SWATH on a TripleTOF 6600+. QuantUMS is tuned per experiment, and the documentation says it is "particularly beneficial for Orbitrap Astral data due to the high quality of its MS1 spectra". Other data could rank the routes differently.
- Only ratios between two conditions are checked. Absolute quantities and large cohorts aren't tested.
- iq and directLFQ were not tuned. I switched off iq's median normalisation (the fragments were already normalised with DIA-NN's factors), while directLFQ applied its own sample normalisation on top; otherwise both ran with defaults, with no fragment selection or minimum ion counts. The DIA-NN documentation suggests summing the top 3 fragments for some uses; I didn't test that.
- "Within ±0.5" is one cut-off. Medians and IQRs are reported so that bias and spread can be read separately.
Code and outputs: build, quantification and scoring scripts with their printed output are in sbmlab-benchmarks/diann-quant-modes. The fragment tables (hundreds of MB) are not in the repository; build_inputs.py recreates them from DIA-NN's report.parquet.
Preprint: the benchmark this series uses is written up as a preprint: Kang B. (2026), Scoring the downstream chain of small-n label-free proteomics against known ratios, Research Square, doi:10.21203/rs.3.rs-11370244/v1. It has not been peer reviewed. This quantification-mode comparison is not part of it.
Related
- DIA-NN 2.3 on a known-answer benchmark: the original run, compared with MaxQuant and FragPipe
- DIA-NN 2 report.parquet and pg_matrix in R: reading the outputs used here
- Replicate CVs in MaxQuant, FragPipe and DIA-NN: why a CV depends on which proteins survive
References
- Grossmann J.L., Kistner F., Sinn L.R., Szyrwiel L., Rappsilber J., Demichev V. (2026). Accurate quantification in proteomics with QuantUMS. Nature Biotechnology. doi:10.1038/s41587-026-03131-2
- Demichev V. et al. (2020). DIA-NN: neural networks and interference correction enable deep proteome coverage in high throughput. Nature Methods 17:41–44. doi:10.1038/s41592-019-0638-x
- Pham T.V., Henneman A.A., Jimenez C.R. (2020). iq: an R package to estimate relative protein abundances from ion quantification in DIA-MS-based proteomics. Bioinformatics 36:2611–2613. doi:10.1093/bioinformatics/btz961
- Ammar C. et al. (2023). Accurate label-free quantification by directLFQ to compare unlimited numbers of proteomes. Molecular & Cellular Proteomics 22:100581. doi:10.1016/j.mcpro.2023.100581
- Van Puyvelde B. et al. (2022). A comprehensive LFQ benchmark dataset on modern day acquisition strategies in proteomics. Scientific Data 9:126. doi:10.1038/s41597-022-01216-6
- DIA-NN documentation (README, accessed 17 October 2026), sections "Output" and "Quantification". github.com/vdemichev/DiaNN
관련 글
DIA-NN 2.3 on a Known-Answer Benchmark: How It Compares With MaxQuant and FragPipe (and Why the Comparison Has a Catch)
10월 13일 · 11 min read
ProteomicsProteomics CV: What Replicate CVs Look Like in MaxQuant, FragPipe and DIA-NN (Measured on a Known-Ratio Benchmark)
10월 16일 · 8 min read
ProteomicsFragPipe vs MaxQuant, Measured: Same Six Runs, Same Known Answer (9 Minutes vs 62)
10월 7일 · 10 min read
ProteomicsMaxQuant 2.8 proteinGroups.txt, Scored Against a Known Answer: LFQ vs iBAQ vs Intensity, and What Match-Between-Runs Adds
10월 7일 · 12 min read