Proteomics CV: What Replicate CVs Look Like in MaxQuant, FragPipe and DIA-NN (Measured on a Known-Ratio Benchmark)
Median replicate CV on the same public benchmark: DIA-NN 4.5%, MaxQuant LFQ 8.1%, FragPipe 10.1%, and 20.9% for MaxQuant's raw Intensity column. Why the number depends on the column, on which proteins survive, and on abundance, and whether a low CV means a correct ratio.
"What CV is acceptable?" comes up in almost every proteomics QC discussion, and the usual answer is a single number. I measured replicate CVs on a public benchmark where the true ratios are known, using three engines I had already run on it. The short version: the CV you report depends at least as much on how you compute it as on your data.
Short answer
| Engine (output used) | Median CV | CV < 20% | Protein × condition pairs with all 3 values |
|---|---|---|---|
| DIA-NN 2.3.2 (pg_matrix, SWATH) | 4.5% | 93.6% | 91.3% |
| MaxQuant 2.8.1 (LFQ intensity) | 8.1% | 92.3% | 68.4% |
| FragPipe 24 (MaxLFQ intensity) | 10.1% | 80.1% | 83.9% |
| MaxQuant 2.8.1 (raw Intensity) | 20.9% | 46.6% | 88.9% |
CV = standard deviation / mean of the three linear intensities, per protein and condition, computed only when all three replicates have a value. All species pooled. Source: cv_summary.csv in the repository linked at the end.
Three things in that table matter more than the ranking:
- The same MaxQuant run gives a median CV of 21% or 8% depending on the column. "Intensity" is the summed peptide signal with no normalisation; "LFQ intensity" is MaxLFQ-normalised. If someone tells you their CVs are under 20%, ask which column.
- A low CV can come from dropping proteins. MaxQuant's LFQ column has all three values for only 68% of protein × condition pairs, against 84% for FragPipe and 91% for DIA-NN. The instrument did measure most of the missing ones: in condition A, 1,148 proteins had a raw Intensity in all three runs but not three LFQ values, and 590 of them had no LFQ value at all. MaxLFQ (minimum ratio count 2, the default I used) leaves out proteins without enough peptide ratios; these had a median of 1 razor + unique peptide in their weakest run, against 5.5 for the complete ones. They are also low-abundance: only 12% of proteins in the bottom quartile of raw intensity had all three LFQ values, against 97–99% in the top two quartiles. And they were noisier: their raw-Intensity CV had a median of 31.1%, against 19.9% for the LFQ-complete proteins. A CV without its denominator is half a number.
- The DIA-NN numbers come from a different instrument. DIA-NN ran on the SWATH (TripleTOF 6600+) runs of the same samples; MaxQuant and FragPipe ran on the Orbitrap DDA runs. Read the DIA-NN row as "SWATH + DIA-NN", not as DIA-NN beating the others on equal terms.
The data
PRIDE PXD028735 (Van Puyvelde et al. 2022): two mixtures of human, yeast and E. coli digests, with true log2(B/A) of 0, −1 and +2. Each mixture was prepared three times (Alpha, Beta, Gamma), and I used the first injection of each, so the three "replicates" contain sample preparation and instrument variation but no biological variation. Biological replicates typically give higher CVs, so don't compare your cohort's CVs to these.
The engine runs are the ones from earlier posts: MaxQuant 2.8, FragPipe vs MaxQuant and DIA-NN, all with match-between-runs on. Decoys, contaminants and site-only groups were removed (for FragPipe and DIA-NN, groups containing an accession on MaxQuant's contaminant list: 7 and 4 groups); protein groups mapping to more than one species were dropped.
CV depends on abundance
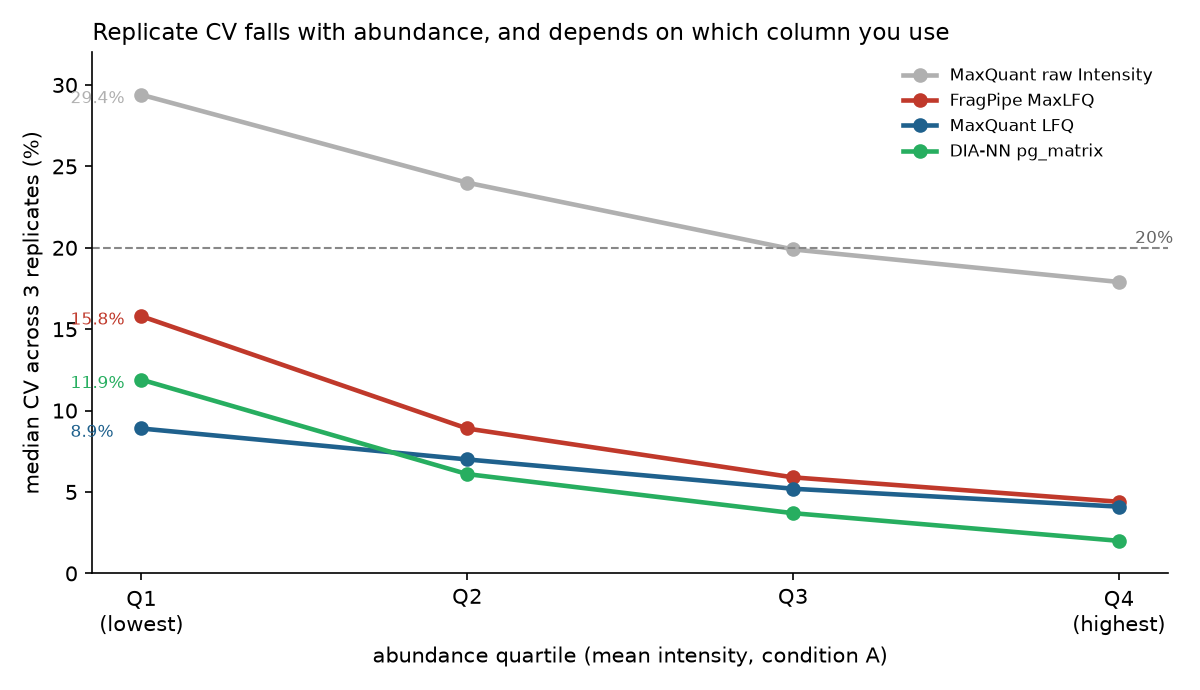 Median CV in condition A by abundance quartile. Quartiles are computed within each engine's own complete proteins, so Q1 is not the same set of proteins across engines.
| Engine | Q1 (lowest) | Q2 | Q3 | Q4 (highest) |
|---|---|---|---|---|
| MaxQuant raw Intensity | 29.4% | 24.0% | 19.9% | 17.9% |
| FragPipe MaxLFQ | 15.8% | 8.9% | 5.9% | 4.4% |
| DIA-NN pg_matrix | 11.9% | 6.1% | 3.7% | 2.0% |
| MaxQuant LFQ | 8.9% | 7.0% | 5.2% | 4.1% |
Every engine shows the same pattern: the bottom quartile has 1.6 to 6 times the CV of the top quartile. A single median CV hides this. MaxQuant LFQ has the smallest absolute spread (8.9% to 4.1%) and the lowest Q1, consistent with its noisiest low-abundance proteins having been left without a full set of LFQ values (point 2 above).
Does a low CV mean a correct ratio?
Because the true ratios are known, I could check whether proteins with low CVs also had accurate fold changes. For proteins complete in both conditions, I split them by the larger of their two CVs and counted how many had a centred log2 ratio within ±0.5 of the truth.
| Engine | Species | Both CVs < 20% | Either CV ≥ 20% |
|---|---|---|---|
| MaxQuant LFQ | Human (0) | 99.9% (n = 2,363) | 97.7% (n = 263) |
| Yeast (−1) | 98.5% (689) | 99.1% (109) | |
| E. coli (+2) | 93.6% (78) | 60.0% (30) | |
| FragPipe MaxLFQ | Human | 99.2% (3,214) | 90.7% (1,107) |
| Yeast | 97.3% (1,103) | 82.4% (510) | |
| E. coli | 87.6% (169) | 67.5% (123) | |
| DIA-NN pg_matrix | Human | 99.6% (4,873) | 95.1% (389) |
| Yeast | 98.1% (1,888) | 92.6% (230) | |
| E. coli | 93.1% (318) | 71.4% (49) |
For the three normalised outputs, mostly yes. The effect is largest for E. coli, the low-abundance species with the biggest true change: proteins with a CV of 20% or more were 20–34 percentage points less likely to have the right ratio. With MaxQuant's raw Intensity, a low CV did not help much: E. coli proteins with both CVs under 20% were right only 51.5% of the time (n = 33), against 44.2% for the rest. Centring on the human median removes a simple loading offset, so something else limits raw-Intensity ratios here; this run doesn't tell me what. For human proteins, which don't change, a high CV cost little. There is one exception: MaxQuant LFQ yeast proteins with a high CV were slightly more accurate (99.1% vs 98.5%, on only 109 proteins), so a CV filter is a tendency, not a rule.
A CV filter also costs proteins. For FragPipe E. coli (proteins complete in both conditions), keeping only those with both CVs under 20% would drop 123 of 292 (42%). All of them are true changes, and 83 of the 123 (67.5%) still had a ratio within ±0.5.
What I would do with this
These are my suggestions from the run above, not an official standard. I don't know of an agreed CV cut-off for discovery proteomics; 20% here is just a round line.
- Report which intensity column the CV was computed from. Normalised and raw intensities from the same search differed by a factor of 2.6 in median CV.
- Report the denominator. "Median CV 8% where 68% of protein × condition pairs were complete" and "median CV 10% where 84% were complete" are not directly comparable.
- Report CV by abundance, or at least for the bottom quartile, rather than one median.
- Use replicate CV as a flag, not a gate. It predicted wrong ratios for low-abundance, strongly changed proteins, but filtering on it removes a lot of real changes. Flagging high-CV hits for a second look is cheaper than discarding them.
- Keep technical and biological CVs apart. The numbers here are preparation-plus-injection CVs; a cohort will be higher.
Limitations
- Three replicates per condition. A CV from three values is itself noisy.
- One dataset, defaults. Settings were mostly engine defaults with MBR on. MBR fills in missing values, which raises completeness and can change CVs.
- Different instruments. DIA-NN used SWATH data; MaxQuant and FragPipe used Orbitrap DDA.
- Accuracy here is ±0.5 log2 around the truth after centring on the human median, with the ratio taken from mean linear intensities and only proteins complete in both conditions. The earlier posts in this series reported uncentred ratios and required 2 of 3 values, so their percentages are not directly comparable with this table.
Code and outputs: the scripts (cv_hye.R, completeness_check.R, figure.py), their printed output and the CSV tables are on GitHub in sbmlab-benchmarks/cv-hye.
Preprint: the benchmark these runs come from is written up as a preprint: Kang B. (2026), Scoring the downstream chain of small-n label-free proteomics against known ratios, Research Square, doi:10.21203/rs.3.rs-11370244/v1. It has not been peer reviewed. Replicate CV is not part of it.
Related
- MaxQuant 2.8 scored on known ratios: LFQ vs raw intensity accuracy on the same run
- Missing values in proteomics: imputation methods scored: what happens to the proteins that don't have all three values
- limma vs DEqMS at small n: what three replicates can and can't detect
References
- Van Puyvelde B. et al. (2022). A comprehensive LFQ benchmark dataset on modern day acquisition strategies in proteomics. Scientific Data 9:126. doi:10.1038/s41597-022-01216-6
- Cox J. et al. (2014). Accurate proteome-wide label-free quantification by delayed normalization and maximal peptide ratio extraction, termed MaxLFQ. Molecular & Cellular Proteomics 13:2513–2526. doi:10.1074/mcp.M113.031591
관련 글
DIA-NN 2.3 on a Known-Answer Benchmark: How It Compares With MaxQuant and FragPipe (and Why the Comparison Has a Catch)
10월 13일 · 11 min read
ProteomicsFragPipe vs MaxQuant, Measured: Same Six Runs, Same Known Answer (9 Minutes vs 62)
10월 7일 · 10 min read
ProteomicsLC-MS/MS Proteomics 입문 — 샘플 준비부터 데이터 분석까지 완전 가이드 2026
5월 18일 · 23 min read
ProteomicsDIA-NN Quantification Modes Scored on Known Ratios: QuantUMS, Legacy MaxLFQ and Fragment-Level Re-Quantification, With and Without MBR
10월 17일 · 17 min read