DIA-NN 2.7.0: Download, Upgrade From 2.3.2, and What Changed on a Known-Ratio Benchmark
I installed DIA-NN 2.7.0 and reran the same six SWATH files I had scored with 2.3.2. It identified 6% more proteins per run and was about as accurate on the proteins both versions quantified, but the extra low-abundance values pulled E. coli accuracy from 85% to 77%. Install steps, the .wiff trap, commands and an upgrade checklist.
DIA-NN 2.7.0 came out on 16 September 2026 and moved to the main release channel on 16 October. I installed it on the same PC and ran the same six SWATH files, with the same settings, that I had scored with 2.3.2 in my known-ratio benchmark. Every number below comes from those two runs. Scripts, logs and protein matrices are in sbmlab-benchmarks. (한국어판: DIA-NN 2.7.0 받기와 업그레이드)
The Short Version
| DIA-NN 2.3.2 | DIA-NN 2.7.0 | |
|---|---|---|
| Proteins identified per run (mean of 6) | 8,198 | 8,708 (+6.2%) |
| Precursors identified per run (mean of 6) | 100,450 | 105,919 (+5.4%) |
| Protein groups with a ratio, human / yeast / E. coli | 5,477 / 2,374 / 446 | 5,574 / 2,533 / 605 |
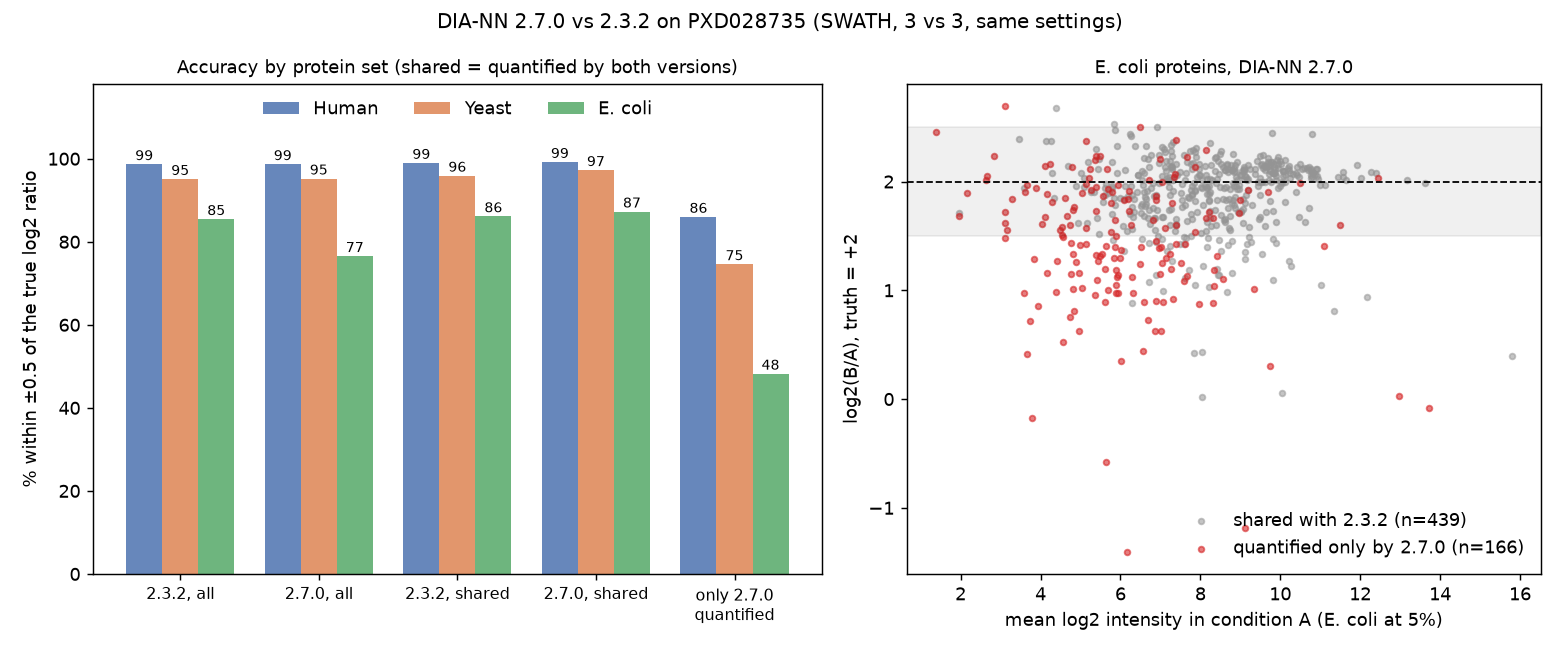
| All of them, within ±0.5 of the true ratio | 98.6% / 95.1% / 85.4% | 98.7% / 95.2% / 76.5% |
| Only the 8,097 both versions quantified | 99.0% / 95.9% / 86.1% | 99.2% / 97.2% / 87.2% |
| Wall time (library + search) | 11 min + 6 h 17 min | 13 min + 9 h 10 min (see the caveat below) |
- 2.7.0 identifies more. About 6% more proteins per run. 2.3.2 to 2.7.0 spans five releases, and their notes promise gains (2.5.0: "major increase in protein numbers", 2.7.0: "several percent").
- On the same proteins it is about as accurate. For the 8,097 protein groups both versions quantified, 2.7.0 was within ±0.5 of the truth slightly more often for all three species.
- The extra quantified proteins are the weak part. 615 protein groups had a ratio only in 2.7.0. Most were low-abundance values that 2.3.2 had left missing, and only 48% of the E. coli ones landed within ±0.5. Within 2.7.0 they pull E. coli accuracy from 87.2% (shared proteins) to 76.5% (all).
- If your files are SCIEX .wiff, a fresh 2.7.0 folder skips them and still finishes with exit code 0. Fix below.
The Data
PRIDE PXD028735 (Van Puyvelde et al., Scientific Data 2022) mixes human, yeast and E. coli digests at known proportions. I used the six SCIEX TripleTOF 6600+ SWATH runs, three per condition:
| Human | Yeast | E. coli | |
|---|---|---|---|
| Condition A | 65% | 30% | 5% |
| Condition B | 65% | 15% | 20% |
| Expected log2(B/A) | 0 | −1 | +2 |
Because the answer is known for every protein, you can check a new version on real data instead of trusting its identification count. The FASTA is the same Swiss-Prot human + yeast + E. coli file (31,695 entries) as in the earlier posts.
Step 1: Download
DIA-NN is on GitHub at vdemichev/DiaNN. The 2.x builds are attached to the release called "DIA-NN 2.0", not to a separate 2.7.0 release, so scroll down to its asset list:
DIA-NN-2.7.0-Academia.msi(Windows, shown as 345 MB on GitHub)DIA-NN-2.7.0-Academia-Linux.zip(Linux, 360 MB)
These are the Academia builds, which the README describes as "limited functionality, for non-profit academic research". The full-featured Enterprise edition is sold through Aptila Biotech or Thermo Fisher Scientific. The release notes for each 2.x version are in the GitHub discussion "DIA-NN 2.0-series Updates".
What the 2.7.0 notes say, in short: performance improvements (especially for heterogeneous experiments, low sample amounts and InfinDIA mode, "expect several percent gain in protein numbers"), more methods detail for its statistics and plots, a fix for a rare integrity check on sparse MS1 spectra, two GUI fixes, pathway-analysis changes, and a new --fwhm option for DDA.
If you are coming from 2.3.2, read the notes for 2.5.0 to 2.6.1 as well. Two of them change the protein matrix you probably use: 2.5.1 "Matrices are now generated without lib q-value filters when using MBR", and 2.6.0 "Output matrices now uses 'Global' filters with MBR". So with identical command lines, the two versions do not filter report.pg_matrix.tsv the same way. I deal with that in the scoring section.
Step 2: Install (and keep the old version)
On Windows, double-clicking the .msi installs it as usual. I wanted 2.3.2 to stay untouched so I could compare, so I unpacked the installer into its own folder instead:
msiexec /a C:\DIA-NN\dl\DIA-NN-2.7.0-Academia.msi /qn TARGETDIR=C:\DIA-NN\2.7.0
That leaves diann.exe (command line) and DIA-NN.exe (GUI) in C:\DIA-NN\2.7.0, next to the old C:\DIA-NN\2.3.2. An unpacked copy has no Start menu shortcut or uninstall entry, and it skips any prerequisite setup the installer would do; it worked here because 2.3.2 had been installed normally on the same PC before. Check the version by running diann.exe with no arguments; the first line of output is DIA-NN 2.7.0 Academia.
On Linux, unzip the Linux build and run diann-linux. The tutorial has the Linux details. One limit matters here: the native Linux build does not read SCIEX .wiff (DIA-NN's README lists .d, .raw, .mzML and .dia for native Linux builds). Either use Windows or convert to .mzML. I used the Windows build.
Step 3: The .wiff Trap
My first 2.7.0 search finished in 2 minutes 35 seconds with exit code 0. It had processed nothing. The console output said 0 files will be processed, and:
ERROR: cannot find Clearcore2.Data.AnalystDataProvider.dll, please copy .dll files as described in
https://github.com/vdemichev/DiaNN?tab=readme-ov-file#raw-data-formats. Wiff files will be skipped.
The installer does not include SCIEX's reading libraries. DIA-NN's README says to install ProteoWizard (64-bit, with vendor support) and copy every .dll whose name contains "Clearcore" or "Sciex" into the DIA-NN folder. My 2.3.2 folder already had those 23 files from when I set it up, so I copied them across and the second attempt read all six files.
Two lessons for any upgrade:
- A new DIA-NN folder starts without the SCIEX DLLs. If you installed into a new folder, copy them again.
- Exit code 0 does not mean success. Check the
N files will be processedline near the start of the output, and the list of warnings and errors that DIA-NN prints at the end of the console (or GUI) output. In the savedreport.log.txtthat list is not repeated; there the error sits near the top.
Step 4: Same Settings as 2.3.2
I rebuilt the predicted library with 2.7.0, using the 2.3.2 parameters (trypsin, 1 missed cleavage, peptides 7 to 30, charge 2 to 4, precursor m/z 300 to 1800, fixed carbamidomethyl C, variable Met oxidation). I did not test whether a 2.3.2 library also works in 2.7.0; rebuilding keeps the library and the search on the same release.
diann.exe --fasta C:\diann-hye\hye_sp.fasta --fasta-search --predictor --gen-spec-lib ^
  --out-lib C:\diann-hye\v270\lib\hye.parquet --cut K*,R* --missed-cleavages 1 ^
  --min-pep-len 7 --max-pep-len 30 --min-pr-charge 2 --max-pr-charge 4 ^
  --min-pr-mz 300 --max-pr-mz 1800 --min-fr-mz 200 --max-fr-mz 1800 ^
  --unimod4 --var-mods 1 --var-mod UniMod:35,15.994915,M --threads 24 --verbose 1
As with 2.3.2, the library was saved as hye.predicted.speclib. It held the same 6,370,129 precursors from 31,635 proteins.
Then the search, with match-between-runs (--reanalyse) on, exactly as in the 2.3.2 run except for the output paths:
diann.exe --f <six .wiff files> --lib C:\diann-hye\v270\lib\hye.predicted.speclib ^
  --fasta C:\diann-hye\hye_sp.fasta --out C:\diann-hye\v270\out\report.parquet ^
  --temp C:\diann-hye\v270\quant --threads 24 --verbose 1 --qvalue 0.01 --matrices ^
  --unimod4 --var-mods 1 --var-mod UniMod:35,15.994915,M --reanalyse --rt-profiling
--temp sends the per-run .quant files to a separate folder. Without it, DIA-NN writes them next to the raw files, where they would have overwritten the 2.3.2 ones.
Step 5: Scoring
I scored report.pg_matrix.tsv with the same rules as every post in this series: a protein group needs values in at least 2 of 3 runs per condition, log2(B/A) is the difference of mean log2 intensities, and it counts as correct if it is within ±0.5 of the truth. Protein groups whose names mix species would be dropped; there were none in either version.
Because the default matrix filter changed between the versions (Step 1), I also rebuilt a protein matrix from each report.parquet with one filter for both (precursor Q ≤ 0.01 and protein group Q ≤ 0.01). The result is the same: E. coli within ±0.5 went from 87.6% of 421 protein groups (2.3.2) to 76.5% of 604 (2.7.0).
Why E. coli Accuracy Dropped
The headline table looks like 2.7.0 got worse at E. coli (85.4% to 76.5%). Splitting the proteins into "quantified by both versions" and "quantified only by 2.7.0" shows what happened:
| Species | Shared, 2.3.2 | Shared, 2.7.0 | Only 2.7.0 | Only 2.7.0: median log2 ratio (truth) |
|---|---|---|---|---|
| Human | 99.0% (n=5,353) | 99.2% | 86.0% (n=221) | −0.03 (0) |
| Yeast | 95.9% (n=2,305) | 97.2% | 74.6% (n=228) | −0.85 (−1) |
| E. coli | 86.1% (n=439) | 87.2% | 48.2% (n=166) | 1.48 (+2) |
Most of these are not new identifications. 391 of the 615 "only 2.7.0" protein groups were already in 2.3.2's matrix; they just had too few values to pass the 2-of-3 rule. For E. coli it is 156 of 166, and in 155 of those 2.3.2 had 0 or 1 value in condition A, where E. coli is only 5% of the sample. 2.7.0 filled in those low-abundance values.
Values near the detection limit are noisy and biased. The proteins quantified only by 2.7.0 have a median log2 intensity in condition A that is lower than the shared proteins' by 4.0 for human (about 16 times weaker), 3.3 for yeast and 2.4 for E. coli. Their ratios scatter more (human, whose true ratio is 0, drops from 99.2% to 86.0% within ±0.5), and for E. coli they are also pulled toward zero: in the right panel of the figure, most red points sit below the +2 line, with a median of 1.48. If the E. coli newcomers are shifted to centre on +2, 65% fall within ±0.5 instead of 48%; the rest of the gap is scatter.
E. coli is hit hardest for two reasons. The newly quantified proteins are 27% of the E. coli set, against 9% for yeast and 4% for human. And for E. coli they are mostly values in its 5% condition, the faintest signals in the experiment.
So on the proteins both versions quantified, 2.7.0 is about as accurate as 2.3.2. It puts numbers on more of the faint end, and the faint end is less accurate. This run cannot tell how many of those faint values are true low signals and how many are wrong matches between runs.
A stricter completeness filter does not fix it. Requiring 3 of 3 values per condition left 562 E. coli proteins in 2.7.0, still only 79.2% within ±0.5 (2.3.2: 89.9% of 367). 2.7.0's matrix is simply more complete (97.1% of cells have a value, against 95.0%), so most of the faint proteins pass 3 of 3 as well. If you upgrade and suddenly see more significant hits with moderate fold changes, check their intensity before trusting them.
About the Run Time
2.7.0 took 9 h 10 min against 6 h 17 min for 2.3.2. Most of the difference is reading the .wiff files: the 12 file loads (six per pass) took 326 minutes against 199, 64% longer, while everything else took 25% longer (224 minutes against 178). The two installs use different versions of DIA-NN's own .wiff reader, and the release notes between them change raw-data loading, so the version may well be responsible. But I ran each version once, at different times, so I cannot separate the version from the machine. For a fair speed test, run both versions back to back on the same PC.
Upgrade Checklist
- Install the new version into its own folder and keep the old one until you have compared them.
- Read the release notes for every version you skip, not just the latest. Matrix filters changed in 2.5.1 and 2.6.0.
- SCIEX .wiff on Windows: copy the Clearcore and Sciex DLLs into the new folder. The native Linux build cannot read .wiff; convert to .mzML there.
- Do not trust the exit code. Check
N files will be processedand the warning list at the end of the console output. - Point
--tempat a new folder if you still need the old.quantfiles. - Compare protein counts per run in
report.stats.tsv, then compare the proteins both versions quantified separately from the new ones. - Look at the intensity of anything newly quantified before you report it.
Limitations
- One dataset (TripleTOF 6600+ SWATH, 3 vs 3) and one run per version. Orbitrap or timsTOF data may behave differently, and the release note says the gains are largest on heterogeneous experiments and low sample amounts, which this is not.
- I kept the 2.3.2 settings. I did not test the new options or the InfinDIA mode.
- Accuracy here means agreement with known mixing ratios. It does not test identification error rates directly.
Related Posts
Related
DIA-NN 2.3 on a Known-Answer Benchmark: How It Compares With MaxQuant and FragPipe (and Why the Comparison Has a Catch)
Oct 13 · 11 min read
ProteomicsDIA-NN Quantification Modes Scored on Known Ratios: QuantUMS, Legacy MaxLFQ and Fragment-Level Re-Quantification, With and Without MBR
Oct 17 · 17 min read
ProteomicsProteomics CV: What Replicate CVs Look Like in MaxQuant, FragPipe and DIA-NN (Measured on a Known-Ratio Benchmark)
Oct 16 · 8 min read
ProteomicsMissing Values in Proteomics: Six Imputation Methods Scored Against a Known Answer
Oct 10 · 10 min read