Single-Cell Differential Expression Between Patients: Cell-Level Tests Flag Up to 24% of Genes When Nothing Differs. Pseudobulk vs FindMarkers on Real Donors
We split 8 real donors from the same condition into 4 vs 4 groups, 35 different ways, and ran cell-level tests (Seurat's default Wilcoxon and a Welch t-test, like Scanpy's default) and three pseudobulk tests. With no real difference, cell-level tests gave p < 0.05 for 9-24% of genes and on average up to 347 false discoveries per split. Pseudobulk stayed at or below 5%.
Everything below comes from a simulation with a known answer and from a public 10x data set where the true answer is known by design. Scripts, outputs and figures are public. (한국어판)
TL;DR
- The default differential expression tests in Seurat (
FindMarkers, a Wilcoxon test) and Scanpy (rank_genes_groups, a t-test) treat every cell as a replicate. - When you compare groups of people (patients vs controls, treated vs untreated donors), cells from the same person are not independent. Genes that simply vary between people then look different between the groups.
- We measured it on real data: 8 donors from the same condition (Kang et al. 2018, unstimulated PBMC), split into two groups of 4 in all 35 possible ways. Nothing separates the groups except which people are in them.
- Cell-level tests gave p < 0.05 for 9-24% of genes (5% expected) and on average 16-347 BH 5% "discoveries" per split, all false. In CD14+ monocytes the average was 347 false genes per comparison (single splits: 156-770).
- Pseudobulk tests (sum each donor's cells, then edgeR, DESeq2 or limma-voom) stayed at 1.5-5.6%, with on average at most 3.3 false calls per split.
- When we planted real 2-fold changes, 20-58% of cell-level calls were false; pseudobulk 2-7%. Pseudobulk finds fewer genes, especially in small cell types.
Which question this is about
There are two common uses of differential expression in single-cell data:
- Markers between clusters within the same samples: "what makes cluster 3 different from cluster 5?" Cell-level tests are the usual tool here, and this post does not test that use.
- Conditions between people: "in CD14+ monocytes, which genes differ between patients and controls?" Here the replicate is the person, not the cell. This post is about this case.
Seurat's own differential expression vignette says it directly: analyses that treat individual cells as independent replicates do not account for biological variability, and this pseudoreplication can lead to low p-values because of the large number of cells. Squair et al. (2021) and Zimmerman et al. (2021) showed the same in detail. We wanted to see how large the problem is on a data set many people use, with numbers you can check.
Setup
| Item | Details |
|---|---|
| Real data | Kang et al. 2018 (GEO GSE96583, batch 2): PBMC from 8 lupus patients, pooled and demultiplexed by genotype (demuxlet), so every cell has a known donor. Only the unstimulated cells, demuxlet singlets with a cell-type label: 12,315 cells, of which 11,074 are in the five cell types tested |
| Cell types | The 5 types with at least 20 cells in every donor: CD4 T (5,161 cells), CD14+ monocytes (2,785), B (1,307), CD8 T (1,082), FCGR3A+ monocytes (739) |
| Null truth | The 8 donors split 4 vs 4 in all 35 distinct ways. Every call is false |
| Planted truth | In 10 of the splits, 10% of the tested genes were changed 2-fold by binomial thinning of the counts in one group (half up, half down). The data stay real counts |
| Simulation | 8 simulated donors, 100-400 cells each, 2,000 genes, donor-to-donor SD 0.25 (or 0 as a control), 10 repetitions |
| Cell-level tests | Wilcoxon rank-sum (Seurat's default) and Welch t-test (Scanpy's default 't-test' is a Welch t-test) on log-normalised counts |
| Pseudobulk tests | Counts summed per donor, then edgeR quasi-likelihood, DESeq2 (Wald) and limma-voom |
| Calls | Benjamini-Hochberg at 5% for every method |
Results
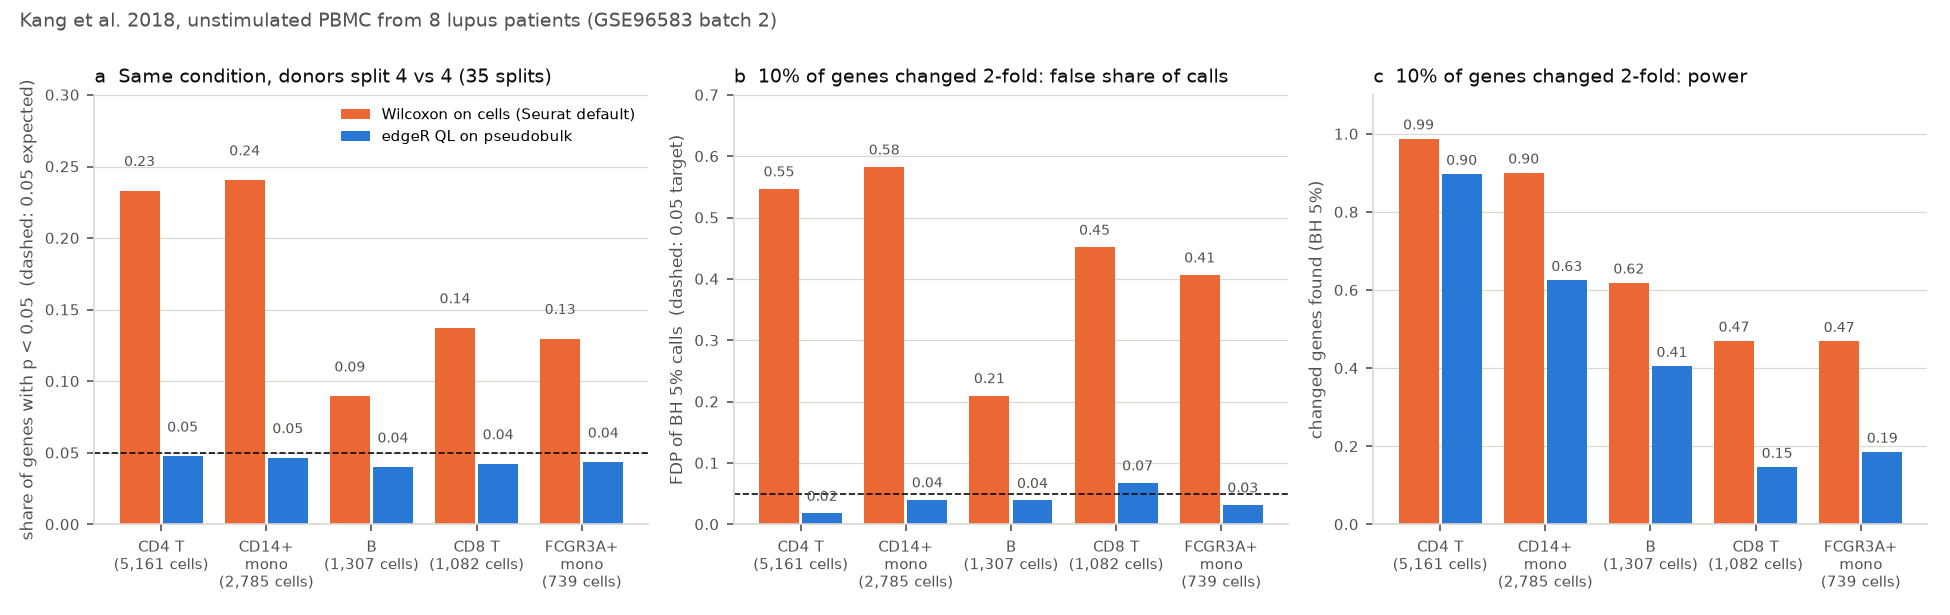
Kang 2018, same condition, donors split 4 vs 4 (35 splits; planted: 10 splits):
| Cell type | Cells | p < 0.05, Wilcoxon on cells | p < 0.05, pseudobulk (edgeR / DESeq2 / limma) | False calls, mean per split, Wilcoxon | False calls, mean per split, pseudobulk | Planted: false share of calls, Wilcoxon / pseudobulk | Planted: power, Wilcoxon / pseudobulk |
|---|---|---|---|---|---|---|---|
| CD4 T | 5,161 | 0.233 | 0.048 / 0.029 / 0.054 | 271 | 1.5-3.3 | 0.55 / 0.02 | 0.99 / 0.84-0.90 |
| CD14+ monocytes | 2,785 | 0.241 | 0.046 / 0.032 / 0.046 | 347 | 0.2-1.2 | 0.58 / 0.04-0.06 | 0.90 / 0.61-0.63 |
| B | 1,307 | 0.090 | 0.040 / 0.015 / 0.049 | 18 | 0.2-0.3 | 0.21 / 0.02-0.04 | 0.62 / 0.23-0.43 |
| CD8 T | 1,082 | 0.137 | 0.042 / 0.015 / 0.056 | 77 | 0.7-0.9 | 0.45 / 0.04-0.07 | 0.47 / 0.07-0.16 |
| FCGR3A+ monocytes | 739 | 0.130 | 0.043 / 0.022 / 0.050 | 87 | 0.2-0.8 | 0.41 / 0.03-0.04 | 0.47 / 0.17-0.20 |
The cell-level t-test gave almost the same numbers as Wilcoxon (all rows are in the repository).
Simulation (10 repetitions, donor-to-donor SD 0.25): with no difference between the groups, cell-level tests gave p < 0.05 for 47% of genes and about 720 false discoveries per repetition; pseudobulk 4.9-5.3% and none. Without donor variation, cell-level tests were calibrated (5.0-5.1%). The problem is the donor, not the test.
What the numbers say
1. On real donors, the default test finds hundreds of "differences" between groups that do not differ. In CD14+ monocytes, a 4 vs 4 comparison of the same condition gave on average 347 genes at BH 5% (156-770 across splits). Every one of them is a difference between people that happens to line up with the split. Across all 35 splits, every cell-level run made at least one false call.
2. The largest cell types were the worst. The two largest cell types (CD4 T with 5,161 cells, CD14+ monocytes with 2,785) had the highest inflation, about 23-24%. Cell-level p-values shrink with the number of cells, while the difference between people stays the same. Cell count is not the only driver: B cells (1,307) were milder than CD8 T cells (1,082), so how much the donors differ also varies by cell type.
3. Real changes do not fix it. With 10% of genes truly changed 2-fold, cell-level tests found most of them, but 20-58% of their calls were false. The high power is real, and so is the noise mixed into it.
4. Pseudobulk pays in power. With 4 donors per group, pseudobulk found 84-90% of the changed genes in CD4 T cells but only 7-20% in the two smallest cell types. That mostly reflects how much evidence 4 vs 4 people give; the pseudobulk methods also differ somewhat (CD8 T: DESeq2 0.07, limma-voom 0.16).
5. DESeq2 on pseudobulk is conservative here (1.5-3.2% of genes at p < 0.05 under the null). edgeR and limma-voom were close to 5%.
What to do instead
- Compare people, not cells. Sum the counts of each donor within each cell type, and test the donors with a bulk RNA-seq method.
- In Seurat (v5), the differential expression vignette shows this with
AggregateExpression(obj, assays = "RNA", return.seurat = TRUE, group.by = c("condition", "donor", "cell_type")), followed byFindMarkers(..., test.use = "DESeq2")on the aggregated object. - In plain R, this is what our benchmark runs for one cell type (
counts: genes × cells,donorandgroupper cell):
library(edgeR)
donor <- factor(donor)
pb <- as.matrix(counts %*% Matrix::sparseMatrix(i = seq_along(donor), j = as.integer(donor), x = 1,
                                                dims = c(length(donor), nlevels(donor))))
colnames(pb) <- levels(donor)
pb_group <- factor(tapply(as.character(group), donor, `[`, 1)[colnames(pb)],
                   levels = c("control", "case"))   # set your own labels; coef 2 = case vs control
y <- calcNormFactors(DGEList(pb))
design <- model.matrix(~ pb_group)
fit <- glmQLFit(estimateDisp(y, design), design)
res <- glmQLFTest(fit, coef = 2)
topTags(res)
- Like the benchmark, filter out rarely detected genes first (it keeps genes detected in at least 5% of cells;
filterByExprdoes a similar job). - Count donors when you plan. With 4 donors per group, expect to find mainly large changes in large cell types. More donors raise pseudobulk power; cells per donor matter too, as the gap between CD4 T cells and the small cell types shows.
- Keep cell-level tests for what they answer: markers between clusters in the same samples. A small p-value from
FindMarkersbetween conditions says the cells differ, and with donors in the groups that is true for nearly every gene that varies between people.
Limits
- One real data set, one tissue (PBMC), and 4 vs 4 donors. Studies with more donors per group will see less pseudobulk power loss, and the size of the cell-level inflation depends on how much the donors differ.
- Planted changes are uniform 2-fold changes in 10% of genes, made by thinning counts. Real effects vary in size and can differ between cells of the same type.
- Mixed models (cells nested in donors) and MAST were not run here. They are an alternative to pseudobulk for the same problem.
- The comparison is between groups of donors. It says nothing about cluster markers within the same samples.
Reproduce it
Data download, scripts, outputs and figures: sbmlab-benchmarks/scrna-pseudobulk-de. bash download.sh fetches the Kang 2018 batch-2 files (about 60 MB kept on disk), and KANG_CORES=12 Rscript kang_study.R data runs all splits in about 2 minutes on a workstation (R 4.3.3, edgeR 4.0.16, DESeq2 1.42.1, limma 3.58.1). The simulation runs with Rscript sim_study.R and is re-run in CI on every change.
References
- Kang HM, Subramaniam M, Targ S, et al. Multiplexed droplet single-cell RNA-sequencing using natural genetic variation. Nat Biotechnol 2018;36(1):89-94.
- Squair JW, Gautier M, Kathe C, et al. Confronting false discoveries in single-cell differential expression. Nat Commun 2021;12:5692.
- Zimmerman KD, Espeland MA, Langefeld CD. A practical solution to pseudoreplication bias in single-cell studies. Nat Commun 2021;12:738.
- Robinson MD, McCarthy DJ, Smyth GK. edgeR: a Bioconductor package for differential expression analysis of digital gene expression data. Bioinformatics 2010;26(1):139-140.
Related
Related
DESeq2 vs edgeR vs limma-voom: Which to Use for RNA-seq (by Sample Size, with R Code)
May 4 · 15 min read
BioinformaticsCorrect Batch Effects, Then Test? With an Unbalanced Design, ComBat Turns a 5% False-Positive Target into 29%
Nov 4 · 10 min read
BioinformaticsCan an LLM Run an RNA-seq Analysis on Its Own? Building ARIA, a Decision-Aware Transcriptome Framework
Jun 2 · 6 min read
BioinformaticsSingle-Cell RNA-seq Analysis: Complete Guide from Raw Data to Cell Type Annotation (2026)
May 4 · 16 min read