STRING Enrichment and the Background Trap: 300 Random Proteins, About 100 'Significant' GO Terms
I gave STRING lists of randomly chosen detected proteins, where the right answer is 'nothing enriched'. With its default whole-genome background it returned 63–168 GO/KEGG terms every time; with the detected proteins as background, zero.
Most enrichment results from proteomics that I review were run on STRING's website or with STRINGdb in R, with default settings. The default compares your list against every protein in the genome. A proteomics experiment never measures every protein in the genome, and that mismatch alone can produce long, convincing-looking enrichment tables.
To see how large the effect is, I ran a test where the right answer is known.
The Test
Detected proteins. In my DIA-NN benchmark run on a public dataset (PXD028735), 5,661 human protein groups were identified; 5,686 STRING identifiers mapped to them. These are the proteins the experiment could see. Like every proteome measurement, they lean toward abundant, housekeeping proteins: the nucleus, RNA processing, metabolism.
A list with no biology in it. I drew 300 of those detected proteins at random. A random draw from the detected proteins has no reason to be enriched for anything, so the correct answer is "no terms".
Two backgrounds. Each list went to STRING (v12.0) twice:
- the default background, the whole human genome (what the website and
get_enrichment()use unless told otherwise); - the 5,686 detected proteins (
set_background()).
I repeated the draw 20 times, so the result does not hang on one lucky sample. I then planted a real signal to check that the correct background does not just suppress everything (below).
The Code
STRINGdb 2.14.3, R 4.3. This is the whole test for one draw, exactly as I ran it:
library(data.table); library(STRINGdb)

# 1. Proteins actually detected in the experiment (here: human protein groups in a DIA-NN pg_matrix)
pg  <- fread("report.pg_matrix.tsv")
det <- pg[grepl("_HUMAN", Protein.Names) & !grepl("_YEAST|_ECOLI", Protein.Names),
          .(acc = sub(";.*", "", Protein.Group))]

string_db <- STRINGdb$new(version = "12.0", species = 9606, score_threshold = 400,
                          input_directory = "string_cache")
det <- as.data.table(string_db$map(as.data.frame(det), "acc", removeUnmappedRows = TRUE))
background <- unique(det$STRING_id)

# 2. A list with no biology in it: 300 detected proteins picked at random
set.seed(1)
hits <- sample(background, 300)

# 3. Same list, two backgrounds
genome_bg <- string_db$get_enrichment(hits)                 # STRING default: whole genome

invisible(string_db$set_background(background))             # detected proteins only
detected_bg <- string_db$get_enrichment(hits)

go_kegg <- c("Process", "Component", "Function", "KEGG")
sig <- function(e) subset(e, fdr < 0.05 & category %in% go_kegg)
c(genome = nrow(sig(genome_bg)), detected = nrow(sig(detected_bg)))
head(sig(genome_bg)[order(sig(genome_bg)$fdr), c("category", "description", "fdr")], 8)
Output:
  genome detected
     115        0
     category                              description      fdr
104 Component                            Nuclear lumen 1.08e-17
105 Component            Intracellular organelle lumen 1.21e-17
106 Component               Membrane-bounded organelle 2.25e-17
107 Component Intracellular membrane-bounded organelle 2.60e-17
108 Component                              Nucleoplasm 4.14e-16
109 Component                                  Nucleus 2.17e-15
110 Component       Intracellular anatomical structure 7.85e-15
111 Component                                Organelle 1.04e-14
set_background() also reloads the network, so the first call downloads STRING's human links file (79 MB) into string_cache. Without invisible() it prints the whole igraph object.
Results: 20 Random Lists
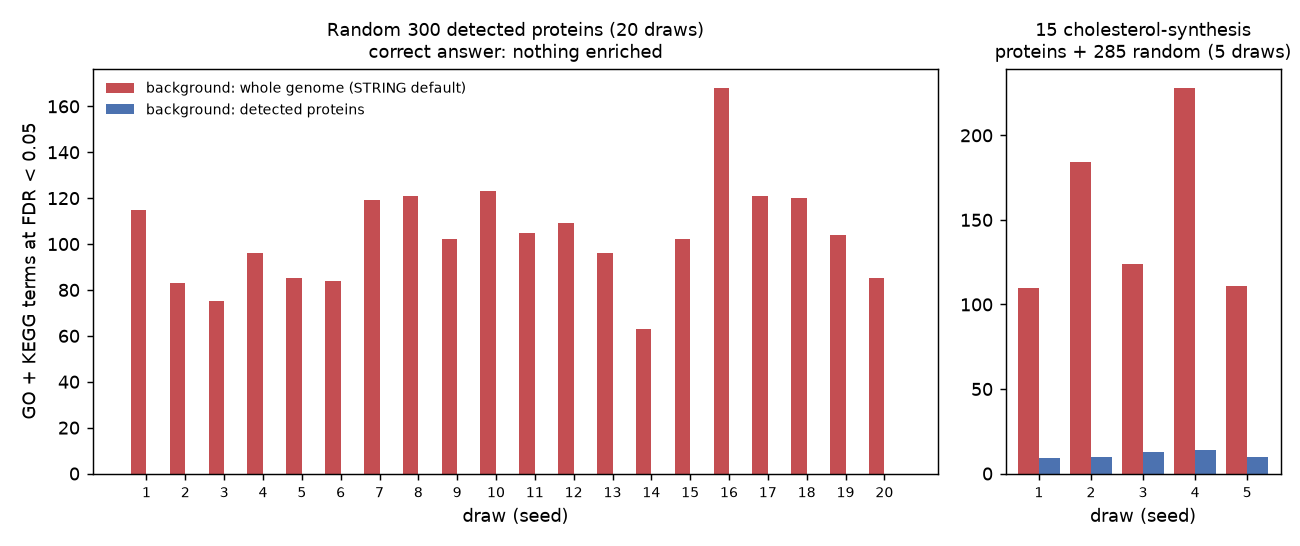
| 20 random lists of 300 detected proteins | Whole-genome background | Detected-protein background |
|---|---|---|
| GO + KEGG terms at FDR < 0.05, median | 103 | 0 |
| Range across the 20 lists | 63–168 | 0–0 |
| All STRING categories (also Reactome, tissues, compartments, keywords, HPO…) | 143–439 | 0 |
With the default background, every random list came back with roughly a hundred "significant" GO and KEGG terms. With the detected proteins as background, not one list returned a single term in any category.
Many of the false terms are generic (metabolic process, nucleus, organelle lumen). Those are easy to dismiss. More worrying are the ones that look like findings:
- Reactome: "Cell Cycle" (13 of 20 lists), "Infectious disease" (12), "Cellular responses to stress" (10), "Translation" (9), "SARS-CoV Infections" (6);
- KEGG: "Amyotrophic lateral sclerosis" and "Huntington disease" (5 of 20 each), "Spliceosome" (4), "Prion disease" (3);
- GO Process: "RNA processing" (19 of 20), "Intracellular transport" (14), "Cell cycle" (8).
Every one of these came from proteins picked at random. They reflect what a mass spectrometer detects easily, not anything about the samples.
Does the Right Background Hide Real Signal?
A background that returns nothing would be useless if it also missed real biology. So I planted a pathway: 15 proteins from cholesterol biosynthesis (Reactome; 17 of its proteins were detected) mixed with 285 random detected proteins, five draws.
| 5 planted lists | Whole-genome background | Detected-protein background |
|---|---|---|
| GO + KEGG terms at FDR < 0.05 | 110–228 | 9–14 |
| Cholesterol pathway found | 5 of 5 | 5 of 5 |
In the first planted list, the detected background returned nine terms, and all nine were about the planted biology (sterol synthesis and its parent terms): sterol biosynthetic process, cholesterol biosynthetic and metabolic process, steroid biosynthetic and metabolic process, isoprenoid biosynthetic process, organic hydroxy compound biosynthetic process, and the KEGG pathways terpenoid backbone biosynthesis and steroid biosynthesis.
The whole-genome background found the cholesterol terms too, but buried them: 110 terms, only 7 of them about sterols or lipids, and the first cholesterol-related term ranked 21st, below cytosol, organelle and "metabolic process". In a figure that shows the top 10 or 20 terms, the real result would not appear.
Why This Happens
Enrichment asks whether your list contains more members of a term than you would expect by chance. "By chance" depends on what you could have drawn from. A typical proteomics run detects a few thousand proteins, and they are not a random quarter of the genome: abundant, ubiquitously expressed, soluble proteins are detected far more easily. Compared with the whole genome, any list drawn from the detected proteins is "enriched" for nuclear, RNA-processing and metabolic proteins, because the measurement already was.
The fix is to ask the right question: is my list enriched compared with what the experiment could have found?
What to Use as the Background
- R, STRINGdb:
string_db$set_background(detected_string_ids)beforeget_enrichment(), as above. - STRING website: the enrichment analysis lets you replace the statistical background with your own list; upload the detected proteins there. The default is the whole genome.
- clusterProfiler:
enrichGO(gene = hits, universe = detected_genes, ...)andenricher(..., universe = ...). Withoutuniverse, every gene with an annotation is used. - What counts as "detected": the proteins that entered the statistical test, i.e. after your valid-value filter. Proteins identified in one run but filtered out before testing could never have appeared in the hit list either.
Limits of This Test
- One instrument and one sample type (the human cell-line digest in a three-species benchmark). Plasma or tissue proteomes are even more skewed toward abundant proteins, so I would expect the effect to be at least as large there, but I did not test it.
- The null lists were random draws, not real hit lists. Real results contain real biology plus this bias; the test shows how much of a typical table the bias alone can produce.
- I counted GO and KEGG at STRING's FDR < 0.05. With a stricter cut-off the numbers would be smaller, but the default background still produced terms at FDR below 1e-15.
- STRING v12.0 through
STRINGdb2.14.3. The website and other tools behave the same way in principle, but I only ran this one.
Related
- STRING database tutorial: network analysis and the other STRINGdb pitfalls
- GO and pathway enrichment: a complete guide
- DIA-NN on a known-answer benchmark: where the detected proteins came from
References
- Szklarczyk D. et al. (2023). The STRING database in 2023: protein–protein association networks and functional enrichment analyses for any sequenced genome of interest. Nucleic Acids Research 51:D638–D646. doi:10.1093/nar/gkac1000
- Timmons J.A., Szkop K.J., Gallagher I.J. (2015). Multiple sources of bias confound functional enrichment analysis of global -omics data. Genome Biology 16:186. doi:10.1186/s13059-015-0761-7
- Van Puyvelde B. et al. (2022). A comprehensive LFQ benchmark dataset on modern day acquisition strategies in proteomics. Scientific Data 9:126. doi:10.1038/s41597-022-01216-6
관련 글
STRING Database Tutorial: Step-by-Step Guide to Protein Network Analysis (2026)
5월 4일 · 15 min read
ProteomicsFrom DIA-NN Output to Paper Draft: A Complete AI-Assisted Proteomics Workflow (2026)
5월 22일 · 14 min read
ProteomicsDifferential Expression Analysis in Proteomics: A Complete R Pipeline (limma, t-test, ANOVA)
2월 25일 · 9 min read
BioinformaticsGO and Pathway Enrichment Analysis: A Complete Practical Guide (clusterProfiler, fgsea, MSigDB)
5월 4일 · 13 min read